
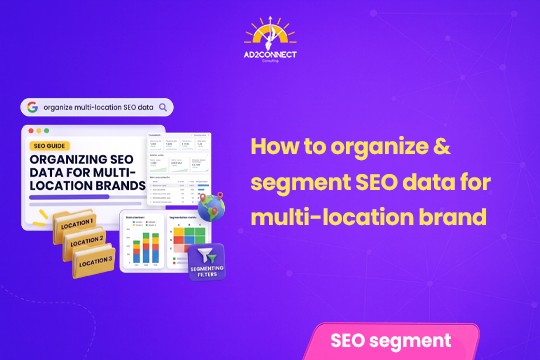
How to Organize & Segment SEO Data for Multi-Location Brand
A single average number won’t tell you what’s working. Here’s how to organize and segment your SEO data by location, so every market gets the attention it actually needs.
By Snehal Singh | Updated 24th September 2026 |
One company-wide SEO number rarely tells the full truth for brands with many locations. A few strong stores can hide several weak ones. New locations can also make overall growth look better than it is. Organize your reporting around clear questions, then segment your data by area, store age, and search type. This shows which markets are truly working, and which ones need help.
Table of Contents
- 1. Why One SEO Number Can’t Tell the Whole Story
- 2. The Data You Should Be Looking At
- 3. Organize Your Reporting Around Real Questions
- 4. Ways to Segment Your Multi-Location SEO Data
- 5. Segmenting by Geography
- 6. TrueView: A Fair Year-Over-Year Comparison
- 7. New Locations, Branded Searches, and Local Pages
- 8. Common Mistakes That Look Like Strategy
- 9. How Ad2Connect Approaches Multi-Location SEO Reporting
- 10. Key Takeaways
- 11. FAQs
Why One SEO Number Can’t Tell the Whole Story
Do you run a business with more than one outlet? You’ve probably seen a report that says “organic traffic is up 15% this year.” Sounds great, right?
But that one number can hide a lot.
Maybe your Malad store had a great year. Maybe your Thane outlet lost half its search traffic at the same time. Or maybe you opened two new stores. Those new stores alone could explain the whole increase. Your older stores might be flat, or even falling.
This is the problem with total, company-wide numbers. They tell you what happened. They don’t tell you where, or why.
The fix is to organize your data properly, then segment it. This means breaking your SEO numbers into smaller, specific groups. Once you do that, you can see the real pattern hiding behind the average.
The Data You Should Be Looking At
Before you organize or segment anything, you need the right numbers. Four sources matter most for a multi-location brand.
Website traffic, conversions, and engagement
Start with your analytics tool, such as Google Analytics 4. Check how many people land on each location page. Then see what they do once they arrive.
A conversion could be a form, a phone call, a booking, or a walk-in enquiry. Engagement numbers, like time on page, add useful context.
Your goal is simple. Find out which pages bring in real business, not just visitors.
Search visibility in Google Search Console
Google Search Console shows clicks, impressions, and average ranking for every page. This includes each of your location pages.
Check this data month over month. Then check it year over year. Look at the actual search terms too. Are people searching your brand name? Or are they searching for a service near them?
Local rankings and Google Business Profile
Rank tracking tools show how a location ranks for “near me” searches. They can even show rankings by pin code.
Your Google Business Profile adds another layer. It shows how many people saw your listing. It shows clicks to your website, phone calls, and direction requests. Review count and rating matter here too. Both affect how often people choose to visit you.
Organize Your Reporting Around Real Questions
Before you slice any data, get clear on what you actually want to know. This is the “organize” part, and most teams skip it.
Don’t just open a dashboard and start scrolling. Start with a real question instead.
- Which locations grew the most, and why?
- Which markets are falling behind the rest?
- Is our growth coming from new stores, or from better SEO?
- Are we winning new customers, or just showing up for people who already know us?
Each question points to a different view of the data. Build your reporting around these views, not around whatever the dashboard shows by default.
This matters because your site structure decides how easily you can segment later. Check how your location URLs are set up first. Then test every filtered view before you trust it. A broken filter can create a false “aha” moment that sends your team chasing the wrong problem.
Ways to Segment Your Multi-Location SEO Data
Once your reporting is organized and the data is ready, segmentation simply means slicing it into smaller, comparable groups instead of staring at one combined total, and the value of this becomes obvious the moment you try it. Picture a business with fifteen locations across Mumbai, Pune, and Bengaluru. It shows a healthy 12% year-over-year rise in organic traffic at the company level. That single number feels like good news. But it could actually be the result of three new stores opening during the year, two older outlets recovering after a Google update, five locations holding perfectly steady, and five more slowly losing ground to local competitors who simply post more often on Google Business Profile. Unless you break the numbers apart by location, store age, and search type, you will never know which of these stories is true. And every decision based on that one top-line number, from budgets to which market gets more attention, ends up being a guess dressed up as a strategy.
Some of the most useful ways to segment multi-location SEO data include:
- By geography — state, region, metro area, or city
- By store age — new locations versus older ones
- By search type — branded versus non-branded queries
- By channel — organic search versus Google Business Profile
- By outlier — top performers and low performers, versus the average
Segmenting by Geography
Geography is usually the first cut. It’s also the easiest one to act on.
Pull your data by city, region, or metro area. Look for outliers. These are locations sitting well above, or well below, the average.
Ask a few simple questions about the low performers:
- Is there heavier local competition in that market?
- Does the store need sharper local keywords, like Bandra or Powai, instead of just “Mumbai”?
- Are two of your own outlets competing for the same keywords by accident?
A store in a small town will never match the search volume of one in South Mumbai. Comparing them on the same scale isn’t fair to either one. Geographic segmentation gives each store a realistic, local benchmark instead.
TrueView: A Fair Year-Over-Year Comparison
Stores open. Stores close. Stores move. If you ignore this, your year-over-year numbers can mislead you badly.
This is where a “TrueView” comparison helps. It means comparing only the stores that were open and active in both time periods.
Here’s why this matters:
- A brand-new outlet will show huge growth, simply because it didn’t exist last year
- A closed outlet will drag your overall numbers down, even if every other store did well
Leaving out both new and closed stores gives you a cleaner picture. It shows how your existing, established stores are really doing. Use TrueView alongside your total numbers, not instead of them. Together, they show whether growth comes from real SEO effort, or simply from opening more stores.
New Locations, Branded Searches, and Local Pages
Track new locations separately
A newly opened store deserves its own view. Watch how fast Google indexes its pages, and how visibility builds after launch. A grand-opening offer can create a short spike that fades. This tells you how much time a new market needs before it performs like an older one.
Branded vs non-branded search
Branded searches mean people are typing your business name. This shows existing awareness. Non-branded searches, like “salon near me” or “best dentist in Malad,” show something else. They show whether new people are discovering you for the first time.
Say your branded search is strong, but non-branded search is weak. Your loyal customers know you well. But you’re not winning many new customers through local search. That’s a very different problem. It needs a different fix.
Organic search vs Google Business Profile
A location page can get traffic from two places. One is a normal Google search result. The other is your Google Business Profile listing.
Check these separately. Use Search Console for organic clicks. Use tagged links for GBP traffic. This shows which one truly drives footfall for each outlet.
Pair the numbers with business context
Numbers alone don’t explain everything. Before you draw conclusions, check what else happened at that location.
Did it move address? Did the website change? Did a competitor open nearby? A ranking dip right after a store move is a location issue. It isn’t always an SEO problem.
What Each Type of Report Tells You (and What It Hides)
| Report Type | What It Shows | What It Can Hide |
|---|---|---|
| Company-wide total | Overall direction of the business | How each single location is doing |
| Geographic segment | Which markets are strong or weak | Store-level detail within a big city |
| TrueView (older stores only) | Real, comparable year-over-year growth | What new locations added to the total |
| Branded vs non-branded search | Awareness vs new-customer discovery | The exact reason behind a keyword drop |
| Organic vs Google Business Profile | Which channel drives more visits | The full, combined page picture |
Common Mistakes That Look Like Strategy
A few habits often get mistaken for good reporting. They aren’t.
- Looking only at the company-wide total, and assuming it reflects every store
- Comparing a brand-new location to a ten-year-old one, on the same scale
- Ignoring branded search, and assuming all traffic means new customers
- Skipping Google Business Profile data because it “isn’t website traffic”
- Reporting a decline without checking if a store closed or moved that month
None of these habits are dishonest. They’re just incomplete. And incomplete data leads to decisions that solve the wrong problem.
How Ad2Connect Approaches Multi-Location SEO Reporting
At Ad2Connect, we don’t hand multi-location clients one traffic number and call it a report. As a Best Local SEO Agency in Mumbai, we organize and build segmented views by city, store age, and search type first. A Mumbai outlet and a Thane outlet rarely need the same fix.
We also pair this SEO segmentation with performance data. As a Performance Marketing Agency in Mumbai, we check how paid and organic channels work together at each location. This way, budget goes where it actually helps.
This store-by-store approach is one reason growing brands choose us as their Digital Marketing Agency in Mumbai. We believe in clear, honest reporting that shows what’s really happening, location by location.
Key Takeaways
- One company-wide SEO number can hide both your best and worst locations
- Organize your reporting around real questions before you start segmenting
- Segment by geography, store age, branded vs non-branded search, and channel
- Use a TrueView comparison to separate real growth from new-location growth
- Always pair the numbers with context, like store closures, moves, or new competitors
- Segmentation isn’t just for explaining the past — it helps you plan what’s next
If your SEO reports only ever show one number for every location, you’re only seeing part of the picture. Talk to Ad2Connect about organizing a segmented reporting view. See exactly which markets need attention, and which ones are quietly doing great.